Unlocking the Power of Data Visualization in Node.js: Chart Generation Explored
A deep dive into chart generation in Node.js and Canvas vs. SVG libraries with implementations.
Introduction
This blog delves into when and how one would consider using Node.js for generating charts, unraveling their impact and suitability in diverse scenarios. We further dissect the world of charting libraries, comparing the intricacies of Canvas and SVG, and their unique advantages in different rendering contexts. By providing detailed insights into the implementation of these libraries within Node.js we aim to equip developers with the knowledge to choose the right tool for their specific needs, ensuring optimal performance and visual clarity in their projects.
We'll explore two primary methodologies of chart rendering in node.js:
1- Native implementation using libraries like G2-ssr-node and chartjs-node-canvas.
2- Headless browser approach with libraries such as X6 and MermaidJS.
Why you should care for chart generation in Node.js?
In most cases, you won't even think about generating charts in Node.js. But this might change in scenarios where client-side rendering of charts is not feasible or optimal. This includes situations where users have limited bandwidth or are using devices with low processing power, making client-side rendering slow or impractical. Additionally, the formation of charts solely on Node.js becomes essential for generating static images of charts for reports, emails, or other offline uses where dynamic and interactive charts are not required. The key is to understand the nuances and requirements of each method to make an informed decision that best suits the project's needs.
Types of charting libraries
When it comes to chart rendering in general, understanding the distinction between SVG-based and Canvas-based libraries is crucial. Both have their unique strengths and are suited for different scenarios, particularly when considering CSR and SSR.
SVG-Based Charting Libraries
- What is SVG? SVG (Scalable Vector Graphics) is an XML-based vector image format. SVG-based charting libraries use the DOM (Document Object Model) to manipulate charts, making them part of the HTML structure.
- Considerations for SVG in Node.js
- Vector Graphics: SVG maintains scalability and resolution independence, which is advantageous for generating high-quality images that might need to be resized or printed.
- Server-Side Libraries: There are Node.js libraries like
d3-node(a server-side adaptation of D3.js) orjsdom(to simulate a DOM environment) that can create SVGs. - File Size and Complexity: SVGs might be more efficient for simpler graphics with less complexity, resulting in smaller file sizes compared to raster images. However, very complex SVGs can become large and unwieldy.
- Direct Manipulation: Unlike SVG, once the image is drawn on a Canvas and exported, you can’t easily manipulate individual elements as you could with SVG.
Canvas-Based Charting Libraries
- What is Canvas? The HTML5 Canvas API provides a means to draw graphics via JavaScript. Canvas-based libraries render pixels directly to a canvas element, creating a bitmap.
- Considerations for Canvas in Node.js
- Pixel-Based Graphics: Canvas generates raster images (like PNG or JPEG), which are resolution-dependent. This might be a limitation if scalability is a concern.
- Libraries for Node.js: Libraries like
canvas(a Node.js implementation of the HTML5 Canvas API) can be used to draw and export images. - Performance with Complex Scenes: For highly complex scenes with numerous elements or intensive effects, Canvas might perform better, as it's optimized for rendering to a bitmap.
- Direct Manipulation: Unlike SVG, once the image is drawn on a Canvas and exported, you can’t easily manipulate individual elements as you could with SVG.
In a Node.js environment for generating static chart images, the choice between SVG and Canvas depends on the nature of the charts you are generating and the specific requirements for scalability, editability, and rendering complexity. SVG offers benefits in terms of scalability and editability, while Canvas is advantageous for rendering performance, especially in complex scenes.
Part 1: Native Implementation in Node.js
1.1 G2-ssr-node -> Canvas-based
What is it?
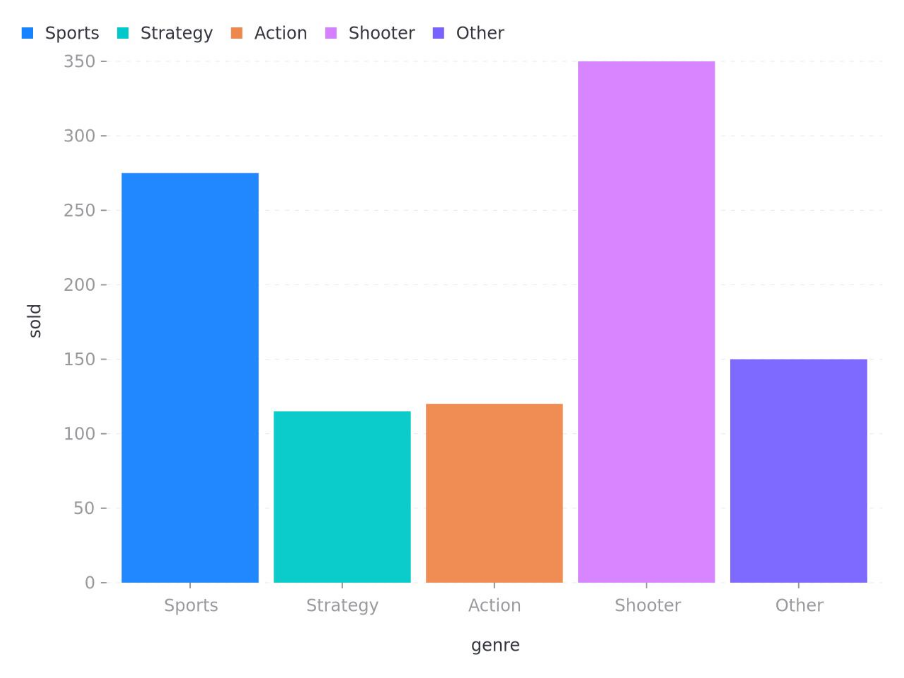
G2-ssr-node is a tool for G2 spec's SSR(Server-Side Rendering) in Node.js. And G2 is a visualization grammar for dashboard building, data exploration, and storytelling.
Implementation:
To install the NPM package type the following command in your terminal:
npm install @berryv/g2-ssr-nodeThe code below generates a bar.png for the given spec. But you can also convert a spec in the CLI. Check the repository for more details.
const fs = require("fs");
const { renderImage } = require("@berryv/g2-ssr-node");

const spec = {
  type: "interval",
  data: [
    { genre: "Sports", sold: 275 },
    { genre: "Strategy", sold: 115 },
    { genre: "Action", sold: 120 },
    { genre: "Shooter", sold: 350 },
    { genre: "Other", sold: 150 },
  ],
  encode: { x: "genre", y: "sold", color: "genre" },
};

renderImage(spec).then((canvas) => {
  const out = fs.createWriteStream("./bar.png");
  const stream = canvas.createJPEGStream();
  stream.pipe(out);
  stream.on("finish", () => console.log("Convert successfully!"));
});
Result
1.2 chartjs-node-canvas
What is it?
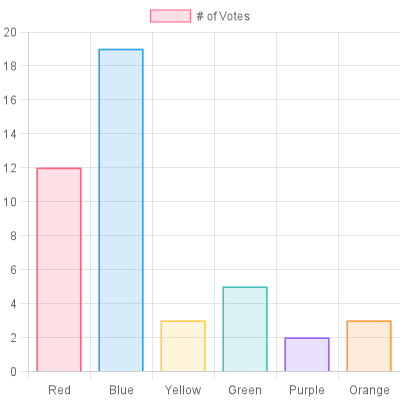
It is a node renderer for Chart.js using Canvas. And Chart.js is a popular open-source library for visualizing data. It allows you to create different types of charts from datasets such as bar charts, pie, lines, donuts, scatters, and many more.
Implementation
Install the NPM package using the following command
npm install chartjs-node-canvas chart.js
Below example export a bar chart in PNG format.
import { ChartJSNodeCanvas } from "chartjs-node-canvas";
import { promises as fs } from "fs";

async function main() {
  const width = 400;
  const height = 400;
  const configuration = {
    type: "bar",
    data: {
      labels: ["Red", "Blue", "Yellow", "Green", "Purple", "Orange"],
      datasets: [
        {
          label: "# of Votes",
          data: [12, 19, 3, 5, 2, 3],
          backgroundColor: [
            "rgba(255, 99, 132, 0.2)",
            "rgba(54, 162, 235, 0.2)",
            "rgba(255, 206, 86, 0.2)",
            "rgba(75, 192, 192, 0.2)",
            "rgba(153, 102, 255, 0.2)",
            "rgba(255, 159, 64, 0.2)",
          ],
          borderColor: [
            "rgba(255,99,132,1)",
            "rgba(54, 162, 235, 1)",
            "rgba(255, 206, 86, 1)",
            "rgba(75, 192, 192, 1)",
            "rgba(153, 102, 255, 1)",
            "rgba(255, 159, 64, 1)",
          ],
          borderWidth: 1,
        },
      ],
    },
    options: {},
    plugins: [
      {
        id: "background-colour",
        beforeDraw: (chart) => {
          const ctx = chart.ctx;
          ctx.save();
          ctx.fillStyle = "white";
          ctx.fillRect(0, 0, width, height);
          ctx.restore();
        },
      },
    ],
  };
  const chartCallback = (ChartJS) => {
    ChartJS.defaults.responsive = true;
    ChartJS.defaults.maintainAspectRatio = false;
  };
  const chartJSNodeCanvas = new ChartJSNodeCanvas({
    width,
    height,
    chartCallback,
  });
  const buffer = await chartJSNodeCanvas.renderToBuffer(configuration);
  await fs.writeFile("./example.png", buffer, "base64");
}
main();
Result
Part 2: Headless browser approach
2.1 X6 -> SVG based
What is it?
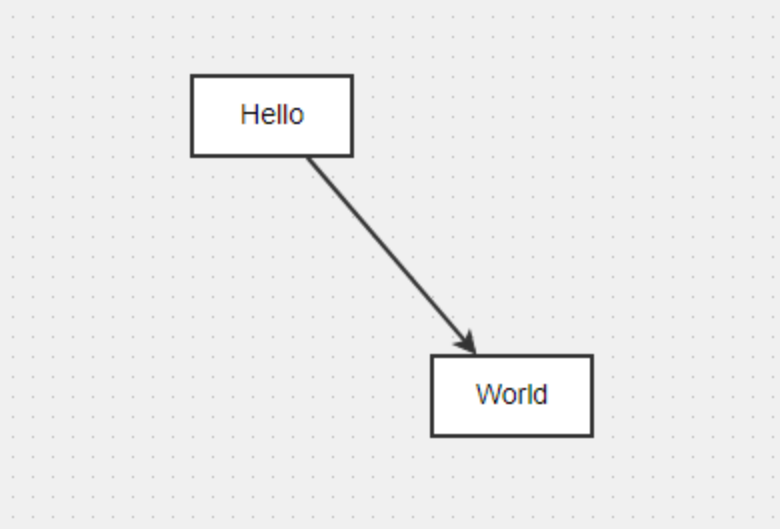
It is a popular JavaScript diagramming library that uses SVG and HTML for rendering.
Implementation
First, start by installing a headless browser. I'll go with puppeteer. Install it using the following command:
npm install puppeteerNow create an HTML file that includes X6 and define your chart.
<!DOCTYPE html>
<html>
  <head>
    <title>X6 Graph with a Single Node</title>
    <script src="https://unpkg.com/@antv/x6@1"></script>
    <style>
      #container {
        width: 600px;
        height: 400px;
        background-color: #f0f0f0;
      }
    </style>
  </head>
  <body>
    <div id="container"></div>
    <script>
      const { Graph, Node } = X6;

      const graph = new Graph({
        container: document.getElementById("container"),
        grid: true,
      });

      const source = graph.addNode({
        x: 300,
        y: 40,
        width: 80,
        height: 40,
        label: "Hello",
      });

      const target = graph.addNode({
        x: 420,
        y: 180,
        width: 80,
        height: 40,
        label: "World",
      });

      graph.addEdge({
        source,
        target,
      });
    </script>
  </body>
</html>
After that create a node.js script that uses puppeteer to render the HTML and takes a screenshot of the webpage.
const puppeteer = require("puppeteer");

(async () => {
  const browser = await puppeteer.launch();
  const page = await browser.newPage();
  await page.setViewport({ width: 1000, height: 800 });
  await page.goto(`file://${__dirname}/graph.html`, {
    waitUntil: "networkidle0",
  });

  await page.screenshot({ path: "graph.png" });
  await browser.close();
})();
Result
2.2 MermaidJS -> SVG based
What is it?
A JavaScript-based diagramming and charting tool that renders Markdown-inspired text definitions to create and modify diagrams dynamically.
Implementation
MermaidJS uses puppeteer under the hood for the generation of SVGs therefore making it easier for us to use it. Moving on, the only way to use mermaid in node.js is to use the mermaid-cli package. To install it type the following in the terminal.
npm install @mermaid-js/mermaid-cli
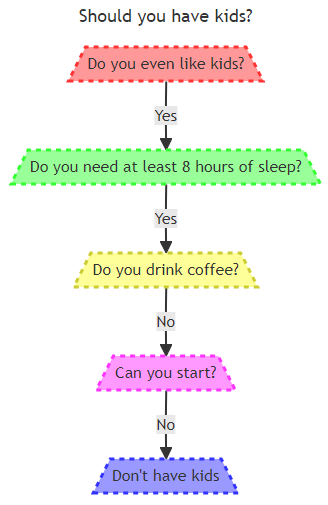
Create a .mmd file and add the configurations. Here I'm creating a flowchart.
---
title: Should you have kids?
---

flowchart TD

  %% Nodes with text labels
  A[/Do you even like kids?\]
  B[/Do you need at least 8 hours of sleep?\]
  D[/Do you drink coffee?\]
  E[/Can you start?\]
  C[/Don't have kids\]

  %% Define node styles
  style A fill:#ff9999,stroke:#ff3333,stroke-width:3px,stroke-dasharray: 5 5
  style B fill:#99ff99,stroke:#33ff33,stroke-width:3px,stroke-dasharray: 5 5
  style C fill:#9999ff,stroke:#3333ff,stroke-width:3px,stroke-dasharray: 5 5
  style D fill:#ffff99,stroke:#cccc33,stroke-width:3px,stroke-dasharray: 5 5
  style E fill:#ff99ff,stroke:#ff33ff,stroke-width:3px,stroke-dasharray: 5 5

  %% Define connections
  A -->|Yes| B
  B -->|Yes| D
  D -->|No| E
  E -->|No| C

  %% Apply node styles
  class A A
  class B B
  class C C
  class D D
  class E E
Running the following command will create an SVG of your chart.
mmdc -i input.mmd -o output.svgResult
Takeaways
In short, the use of charting libraries in Node.js is essential for developers seeking static image/chart generation. Understanding the difference between Canvas and SVG-based libraries is crucial, as each type offers distinct advantages suited for different scenarios. And last but not least, I hope you had a fun time going through this blog.
References

 pearminiSeanSobey
 Theo Vasilis
 antvismermaid-js